

TAM SAM SOM for Founders: Defensible Market Sizing
By Omar Zidan, Founder

TAM, SAM, and SOM are the three-layer market-sizing framework every investor expects to see in a pitch deck. SAM (Serviceable Addressable Market) is the slice your product and geography can actually reach today. SOM (Serviceable Obtainable Market) is the realistic share you can win in the near term, and it’s the number investors scrutinize most. The three-layer framework works like nested circles: TAM contains SAM, SAM contains SOM.
The formulas are straightforward:
- TAM = total potential customers × ARPU (or reference total industry revenue)
- SAM = TAM × product/geography/segment filter
- SOM = SAM × realistic penetration rate (or: last year’s revenue ÷ last year’s SAM × current SAM)
Pro Tip: Build bottom-up first, count real customers and multiply by price, then run a top-down estimate as a sanity check. If both land within the same order of magnitude, your assumptions are likely sound.
Key Takeaways
Bottom-up market sizing, anchored in real customer counts and ARPU, produces the most defensible TAM/SAM/SOM estimates for investor conversations and go-to-market planning.
| Point | Details |
|---|---|
| Build bottom-up first | Count real potential customers × ARPU before applying top-down industry figures as a sanity check. |
| SOM is the investor’s focus | Show SOM math tied to sales capacity and close rate, never as a bare percentage of TAM. |
| Document every assumption | Record source URL, date, and filter logic in a dedicated Assumptions tab so investors can audit quickly. |
| Update with real data | Fold pilot close rates and ACV into your SOM monthly; treat the model as a living document, not a one-time slide. |
| Unthinkable for live signals | Use Unthinkable’s demand-signal feed and AI Advisor to keep SAM filters and SOM estimates current between funding rounds. |
Table of Contents
- What do TAM, SAM, and SOM actually mean?
- How do you calculate TAM, SAM, and SOM?
- Worked examples: SaaS and local retail
- Where to find U.S. market data
- How founders and investors use these numbers differently
- Common mistakes that kill credibility with investors
- How to validate and update your estimates over time
- Why bottom-up sizing beats assumptions every time
- Unthinkable helps you keep your SOM current
- Sources
What do TAM, SAM, and SOM actually mean?
The three metrics are easy to confuse because they all measure “market size.” The difference is in what each one excludes.
TAM: Total Addressable Market is the theoretical ceiling. It answers: if every possible buyer in the world purchased your solution, what would total revenue look like? TAM is a vision metric. It tells investors the category is worth pursuing, but no serious founder expects to capture it. Units can be expressed in customers or in annual revenue, be consistent throughout your model.
SAM: Serviceable Addressable Market is the portion of TAM your product can realistically serve given your current offering, distribution channels, and geography. If you build a B2B SaaS tool for U.S.-based restaurants with fewer than 50 seats, you immediately exclude enterprise chains, international markets, and food trucks that don’t use software. Those exclusions are your TAM-to-SAM filters.
SOM: Serviceable Obtainable Market is the near-term share of SAM you can realistically win given your go-to-market capacity, competitive position, and sales bandwidth. SOM is where the real planning happens. It drives hiring decisions, channel budgets, and 12-month revenue targets.
The relationship is simple: TAM is the ceiling, SAM is the reachable room, SOM is the chair you can actually sit in. When narrowing TAM to SAM, exclude geography you can’t serve, customer segments your product doesn’t fit, and channels you don’t have access to. When narrowing SAM to SOM, factor in your sales team’s capacity, your current brand awareness, and the competitive alternatives buyers already use.
- Exclude from TAM → SAM: international markets (if U.S.-only), enterprise segments (if SMB-focused), offline-only buyers (if digital-only product)
- Exclude from SAM → SOM: accounts outside your sales team’s reach, segments requiring product features on your 18-month roadmap, markets dominated by an entrenched incumbent with high switching costs
How do you calculate TAM, SAM, and SOM?
Four recognized approaches exist for building TAM: third-party research, top-down filtering, bottom-up unit economics, and value-theory. Each has distinct trade-offs.
Top-down method
Start with a published industry revenue figure from an analyst firm like Gartner or Statista, then apply percentage filters to narrow it. For example: "The U.S. restaurant software market is $4.2B.
Bottom-up method
Count the real number of potential customers you could serve, then multiply by your ARPU. Bottom-up is more defensible because it uses unit economics and observable inputs rather than a percentage slice of someone else’s estimate. Starting from one customer and scaling up exposes your conversion assumptions and pricing logic, exactly what investors want to audit.
Value-theory method
Use this when you’re creating a new category or displacing an existing behavior. Estimate the total value your solution creates for customers, then reason about what share you could capture as revenue. Value-theory is harder to defend than bottom-up, so reserve it for genuinely novel markets where no comparable revenue data exists.
Defensibility checklist and cross-check rule
When bottom-up and top-down estimates land within ~15% of each other, your assumptions are likely directionally sound. If they diverge by more than an order of magnitude, revisit your customer count or your ARPU assumptions.
| Method | Data sources | Units | Time horizon | Confidence level |
|---|---|---|---|---|
| Top-down | Gartner, Statista, IBISWorld | Revenue ($) | Long-term TAM | Lower, depends on report quality |
| Bottom-up | BLS counts, Census, CRM data | Customers → Revenue | 12-month SOM | Higher, grounded in unit economics |
| Value-theory | Customer interviews, proxy markets | Value created → Revenue share | Long-term TAM | Lowest, requires novel assumptions |
Spreadsheet layout: Keep three tabs, Assumptions (source URLs, dates, filter logic), Calculations (TAM/SAM/SOM formulas), and Sensitivity (toggle ARPU and penetration rate to show a range). Expose the Assumptions tab to investors. It signals rigor.
Key formulas to wire into your spreadsheet:
TAM = potential_customers × ARPUSAM = TAM × geo_filter × segment_filterSOM = SAM × penetration_rateORSOM = (last_year_revenue / last_year_SAM) × current_SAM
The second SOM formula, dividing last year’s revenue by last year’s SAM and applying that share to current SAM, is particularly useful once you have 12+ months of real revenue data to anchor the estimate.
Worked examples: SaaS and local retail
Example A: B2B SaaS (bottom-up)
Scenario: A project management SaaS targeting U.S.-based marketing agencies with 10-100 employees.
Step 1, Count the ICP. The U.S. Census Bureau’s County Business Patterns data shows approximately 80,000 advertising and marketing services firms in the U.S. Filter to 10-100 employees: roughly 18,000 firms qualify.
Step 3, Set ARPU. Annual contract value (ACV) is $4,800 per firm.
Step 4, Calculate TAM and SAM.
Step 5, Validate SOM against sales capacity. Two sales reps closing 6 deals per month each = 144 new customers per year. 144 × $4,800 = $691K ARR. The penetration rate and the sales-capacity math agree, that’s the signal investors want to see.
Example B: Local retail (hybrid top-down/bottom-up)
Scenario: A specialty coffee roaster opening in Austin, Texas, targeting direct-to-consumer retail and local wholesale.
Step 1, Top-down anchor. IBISWorld estimates the U.S. coffee roasting industry at approximately $12B in annual revenue, consumer spending, giving a state-level proxy of ~$1B.
Step 3, Bottom-up SOM. The roaster can serve 25 local café wholesale accounts at $800/month average order, plus direct retail of $15,000/month. Annual SOM = (25 × $800 × 12) + ($15,000 × 12) = $240,000 + $180,000 = $420,000.
Reasonable for a new local entrant. The top-down and bottom-up numbers are consistent in scale, which validates the assumptions.
Where to find U.S. market data
Reliable data is what separates a defensible model from a number pulled from thin air. Here are the sources worth building into every TAM/SAM/SOM model.
- U.S. Bureau of Labor Statistics (BLS): Industry employment counts, occupational data, and sector-level output figures. Best for counting the number of businesses or workers in a defined category, a critical input for bottom-up customer counts. Free and updated regularly.
- U.S. Census Bureau (census.gov): County Business Patterns, the Economic Census, and the American Community Survey give you business counts by NAICS code, geography, and employee size band. The most defensible public source for U.S. customer-count inputs.
- Statista (statista.com): Aggregated market revenue figures, consumer survey data, and industry forecasts. Useful for top-down TAM anchors and quick sanity checks. Many reports require a paid subscription, but summary statistics are often free.
- Gartner: Analyst forecasts and Magic Quadrant reports for technology markets. Use Gartner abstracts for top-down revenue figures and note in your assumptions sheet that the full report is behind a paywall. Investors recognize Gartner as a credible source.
- IBISWorld: Paid industry reports with revenue, growth rate, and competitive landscape data. Particularly strong for U.S. industry-level revenue benchmarks. Useful when Statista doesn’t cover your niche in enough depth.
Pro Tip: Every source you use should have its URL, publication date, and the specific figure you pulled recorded in your Assumptions tab. Investors who dig into your model will check these. A missing citation reads as a made-up number.
For quick bottom-up builds, BLS and Census data get you to a defensible customer count in under an hour. For formal investor-ready slides, pair those counts with a Gartner or IBISWorld revenue figure as your top-down anchor.
One practical note: market-sizing claims must be presented transparently, with source URLs, dates, and a short assumptions sheet in the model so investors can audit the math quickly. Skipping this step is one of the fastest ways to lose credibility in a due diligence conversation.
Statistic callout: The U.S. Census Bureau’s County Business Patterns covers more than 1,100 industries by NAICS code and geography, making it one of the most granular free datasets available for building bottom-up customer counts in any U.S. market.
How founders and investors use these numbers differently
Investors and founders are reading the same three numbers for completely different reasons.
What investors want to see:
- A TAM large enough to justify venture-scale returns (typically $1B+ for VC-backed startups, though this varies by fund size and stage)
- A SAM that shows you understand your actual market, not just the broadest possible category
- A SOM built from bottom-up math tied to your revenue model and sales capacity, not a percentage of TAM pulled from thin air
- Source citations they can verify in under five minutes
What founders should use these numbers for:
- SAM drives channel and geography prioritization, if your SAM is concentrated in three metro areas, that’s where you hire first
- SOM drives 12-month revenue targets, headcount planning, and go-to-market budget allocation
- Revisiting SOM quarterly keeps your hiring and spend decisions grounded in what’s actually winnable
Pro Tip: On a pitch slide, lead with TAM in one sentence, filter to SAM in one sentence, then spend two sentences on SOM, show the math and the assumptions. Investors have seen thousands of decks; the ones that show the work stand out.
Practical SOM targets by stage often range from modest amounts in early stages to higher sums as companies grow, grounded in sales-team capacity and realistic projections for the business stage. These aren’t rules, they’re the ranges where investors and practitioners expect SOM to land relative to the stage of capital being raised.
One caution: never present SOM as a percentage of TAM without showing the intermediate steps. Instead, demonstrate your calculations through customer counts, average revenue per user, and sales capacity to ensure credibility.
Common mistakes that kill credibility with investors
Most market-sizing errors fall into a small number of patterns. Knowing them in advance saves you from the most avoidable pitch-deck disasters.
Mistake 1: Treating TAM as achievable revenue. TAM is a ceiling, not a target. Presenting it as your revenue opportunity signals that you don’t understand the framework, and that’s a fast path to a pass from any experienced investor.
Mistake 2: Using only top-down numbers. A top-down estimate without a bottom-up cross-check is a number you borrowed from an analyst report and applied a percentage to. Investors know this. Bottom-up market sizing anchored in real customer counts and conversion metrics is what they increasingly require.
Mistake 3: Fuzzy SAM definitions. “Small businesses in the U.S.” is not a SAM. “U.S.-based independent restaurants with 10-50 seats using a POS system” is a SAM. Precision on ICP and geography is what makes the number auditable.
Tie penetration to sales capacity, marketing budget, or a comparable company’s ramp rate.
Mistake 5: Missing source citations. Every figure in your model needs a source. No citation means the number is assumed to be invented.
Fixes, a quick checklist:
- Replace top-down-only estimates with a bottom-up customer count from BLS or Census data
- Define your ICP with at least three specific filters (industry, size, geography or tech stack)
- Tie your SOM penetration rate to a concrete constraint (sales reps × deals per month × ACV)
- Add a source URL and date for every external figure in your Assumptions tab
- Run both top-down and bottom-up and show both in the model
Pro Tip: If your bottom-up SOM is dramatically smaller than your top-down SAM, that’s useful information, it means your go-to-market capacity is the binding constraint, not the market size. Show that gap honestly; it demonstrates self-awareness.
How to validate and update your estimates over time
A TAM/SAM/SOM model built before launch is an educated guess. The goal is to replace assumptions with real data as fast as possible.
-
Run a pilot and record conversion rates. Track lead volume, close rate, and ACV from your first 30-90 days of sales. These three numbers are the inputs to a bottom-up SOM that’s grounded in reality rather than projection.
-
Fold pilot data back into the model. Replace assumed penetration rates with observed close rates. If you projected 5% conversion from outbound and you’re seeing 2.5%, your SOM is half what you modeled. Update it before your next investor conversation.
-
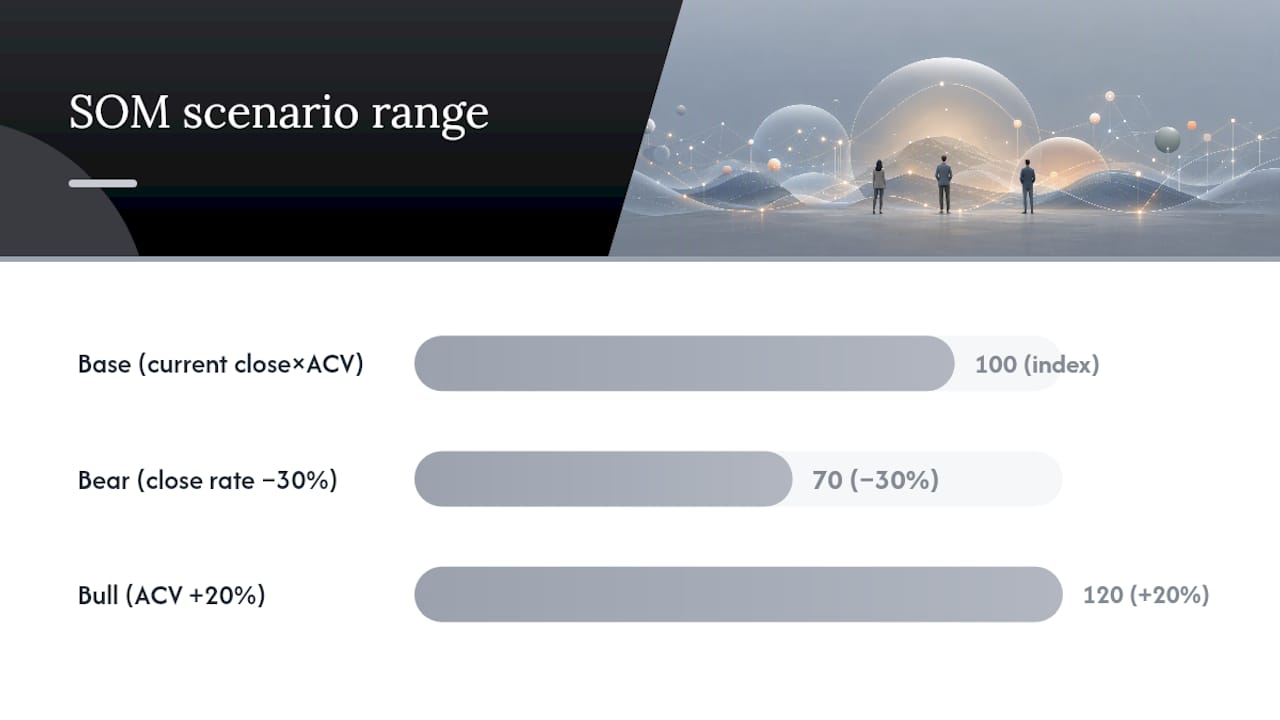
Conduct sensitivity analysis. Build a range, not a point estimate. Show a base case (current close rate × current ACV), a bear case (close rate drops 30%), and a bull case (ACV expands 20% through upsell). Ranges signal intellectual honesty.
-
Set a review cadence. Revisit SOM monthly using your CRM pipeline data. Update SAM quarterly as you expand channels or geographies. Revisit TAM annually or when a major market event (a new competitor, a regulatory change, a macro shift) changes the category size.
-
Use cohort data to refine churn assumptions. SOM is a revenue projection, not just a customer count. If monthly churn is higher than assumed, net revenue retention pulls SOM down. Track cohort retention from month one.
-
Update your assumptions sheet every time you change a number. Date-stamp each revision. Investors who see a model with three dated versions of SOM, each closer to actual results, trust the founder’s judgment far more than one who shows a static slide from the seed deck.
Pro Tip: Convert your early sales metrics directly into SOM: (monthly lead volume × close rate × ACV × 12) = annual SOM. Run this calculation every month. When it diverges from your model, that’s the signal to investigate, not to adjust the model to match the target.
Market-sizing frameworks work best as living documents: founders who update TAM/SAM/SOM as they gather pilot data and expand channels make better resource allocation decisions and show investors a track record of disciplined thinking.
Why bottom-up sizing beats assumptions every time
Here’s the perspective most market-sizing guides skip: the math is the easy part. The hard part is being honest about what you don’t know yet, and building a model that makes your uncertainty visible rather than hiding it behind a confident-sounding number.
Most founders inflate SOM by starting with a large TAM and applying a small percentage. It isn’t. It’s a number with no mechanism behind it. There’s no customer count, no close rate, no sales capacity constraint. It’s a wish dressed up as a forecast.
The bottom-up approach forces discipline. That number has a story. You can defend every input. That’s the kind of model that builds trust in a room full of skeptical investors.
The other thing most guides understate: your SOM is only as good as your demand signal. If you’re sizing a market based on industry reports from two years ago and a Census dataset that hasn’t been refreshed, you’re building on stale ground. The founders who update their models with real demand data, actual search volume, real purchase intent signals, live customer conversations, consistently produce more accurate SOM estimates and make faster go-to-market decisions.
Unthinkable helps you keep your SOM current
Calculating SOM once for a pitch deck is a start. Keeping it accurate as your market shifts is where most founders fall short. Unthinkable gives you a live feed of demand signals pulled from real activity across the web, so your market-sizing assumptions don’t go stale between funding rounds.
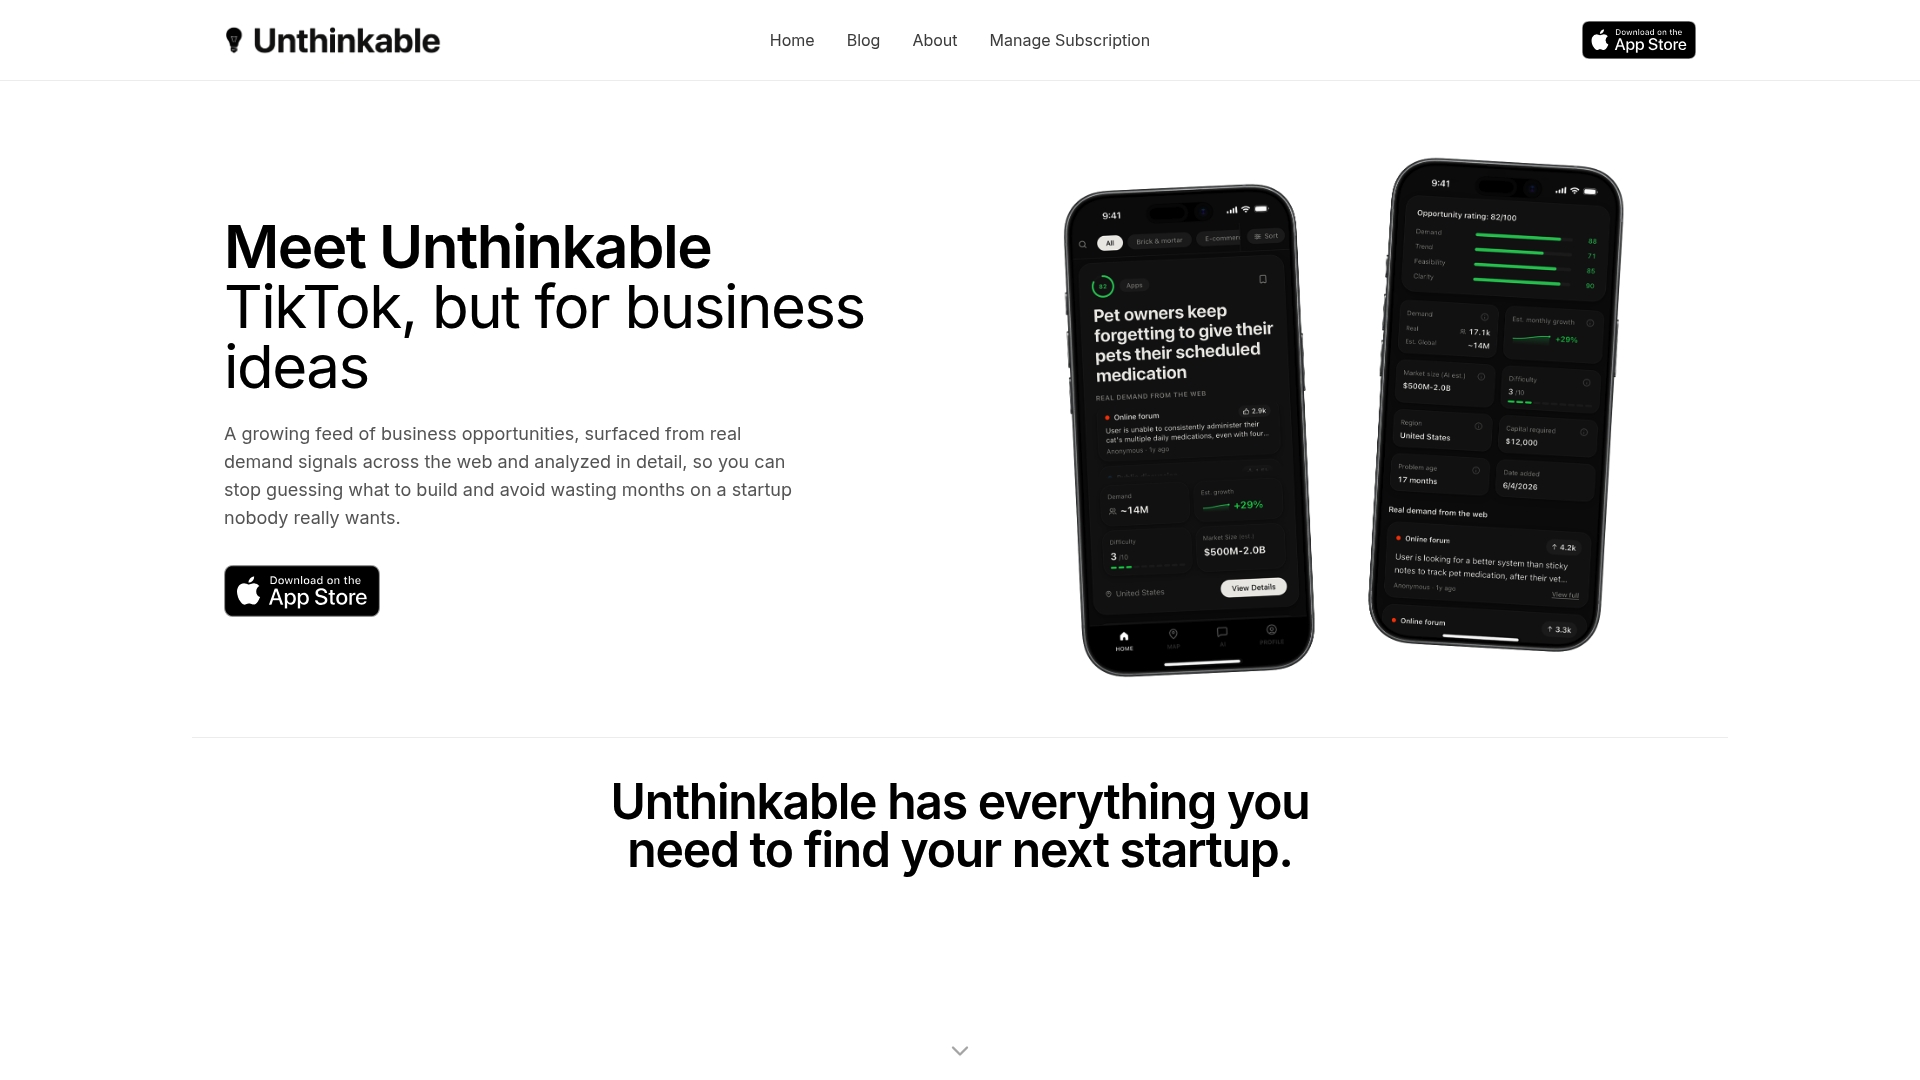
The platform’s Global Opportunity Finder surfaces underserved niches by location, the kind of granular demand data that makes your SAM filters defensible and your SOM projections grounded in what buyers are actually looking for right now. The AI Advisor then helps you map an MVP and plan a launch sequence around those signals. This is a data and AI platform, not a market research service, it’s built for founders who want to operationalize their SOM, not just calculate it once. Download Unthinkable and start sizing your market with real demand data behind every assumption.
Sources
Every figure in your TAM/SAM/SOM model needs a citable source. These are the datasets and analyst resources worth building into your standard research workflow.
- How to calculate your startup’s TAM, SAM and SOM | TechCrunch
- TAM, SAM, and SOM: Made Simple for Growing Businesses | Salesforce
- TAM SAM SOM: Explained with Examples | Wall Street Oasis
- What is TAM SAM SOM? | TechTarget
Practical rule: every time you pull a figure from any of these sources, paste the URL and the date of the report into your Assumptions tab immediately. A model with dated, linked sources takes 20 minutes to build correctly and saves hours of back-and-forth during due diligence.
For conducting a structured market analysis that converts raw data into usable TAM/SAM/SOM numbers, the American Marketing Association’s framework, identify target customer, assess market trends, analyze competition, gives you a repeatable process to layer on top of these data sources.